In the first three parts of the series we have covered three static models of the innovation management theory: Schumpeter, the Incremental – Radical dichotomy and the Henderson – Clark model (if you have not you can click here to read part 1, part 2 or part 3).
Understanding these three theories will create a good (although not perfect) view regarding what company will be in a better position to innovate and under what circumstances. One of the flaws of the models, however, is that they do not predict when a technological discontinuity will take place, hence why they are called static.
In this article I will introduce the S-curve framework, which is particularly useful for analyzing technological cycles and predicting the introduction, adoption and maturation of innovations.
The S-Curve Framework
The S-Curve emerged as a mathematical model and was afterwards applied to a variety of fields including physics, biology and economics. It describes for example the development of the embryo, the diffusion of viruses, the utility gained by people as the number of consumption choices increases, and so on.
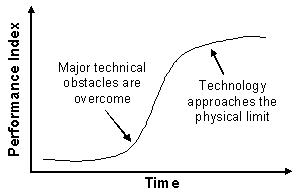
In the innovation management field the S-Curve illustrates the introduction, growth and maturation of innovations as well as the technological cycles that most industries experience. In the early stages large amounts of money, effort and other resources are expended on the new technology but small performance improvements are observed. Then, as the knowledge about the technology accumulates, progress becomes more rapid. As soon as major technical obstacles are overcome and the innovation reaches a certain adoption level an exponential growth will take place. During this phase relatively small increments of effort and resources will result in large performance gains. Finally, as the technology starts to approach its physical limit, further pushing the performance becomes increasingly difficult, as the figure below shows.
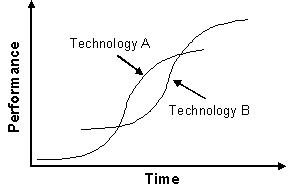
Consider the supercomputer industry, where the traditional architecture involved single microprocessors. In the early stages of this technology a huge amount of money was spent in research and development, and it required several years to produce the first commercial prototype. Once the technology reached a certain level of development the know-how and expertise behind supercomputers started to spread, boosting dramatically the speed at which those systems evolved. After some time, however, microprocessors started to yield lower and lower performance gains for a given time/effort span, suggesting that the technology was close to its physical limit (based on the ability to squeeze transistors in the silicon wafer). In order to solve the problem supercomputer producers adopted a new architecture composed of many microprocessors working in parallel. This innovation created a new S-curve, shifted to the right of the original one, with a higher performance limit (based instead on the capacity to co-ordinate the work of the single processors).
Usually the S-curve is represented as the variation of performance in function of the time/effort. Probably that is the most used metric because it is also the easiest to collect data for. This fact does not imply, however, that performance is more accurate than the other possible metrics, for instance the number of inventions, the level of the overall research, or the profitability associated with the innovation.
One must be careful with the fact that different performance parameters tend to be used over different phases of the innovation, as a result the outcomes may get mixed together, or one parameter will end up influencing the outcome of another. Civil aircraft provides a good example, on early stages of the industry fuel burn was a negligible parameter, and all the emphasis was on the speed aircrafts could achieve and if they would thus be able to get off the ground safely. Over the time, with the improvement of the aircrafts almost everyone was able to reach the minimum speed and to take off, which made fuel burn the main parameter for assessing performance of civil aircrafts.
Overall we can say that the S-Curve is a robust yet flexible framework to analyze the introduction, growth and maturation of innovations and to understand the technological cycles. The model also has plenty of empirical evidence, it was exhaustively studied within many industries including semiconductors, telecommunications, hard drives, photocopiers, jet engines and so on.
Comments are closed.